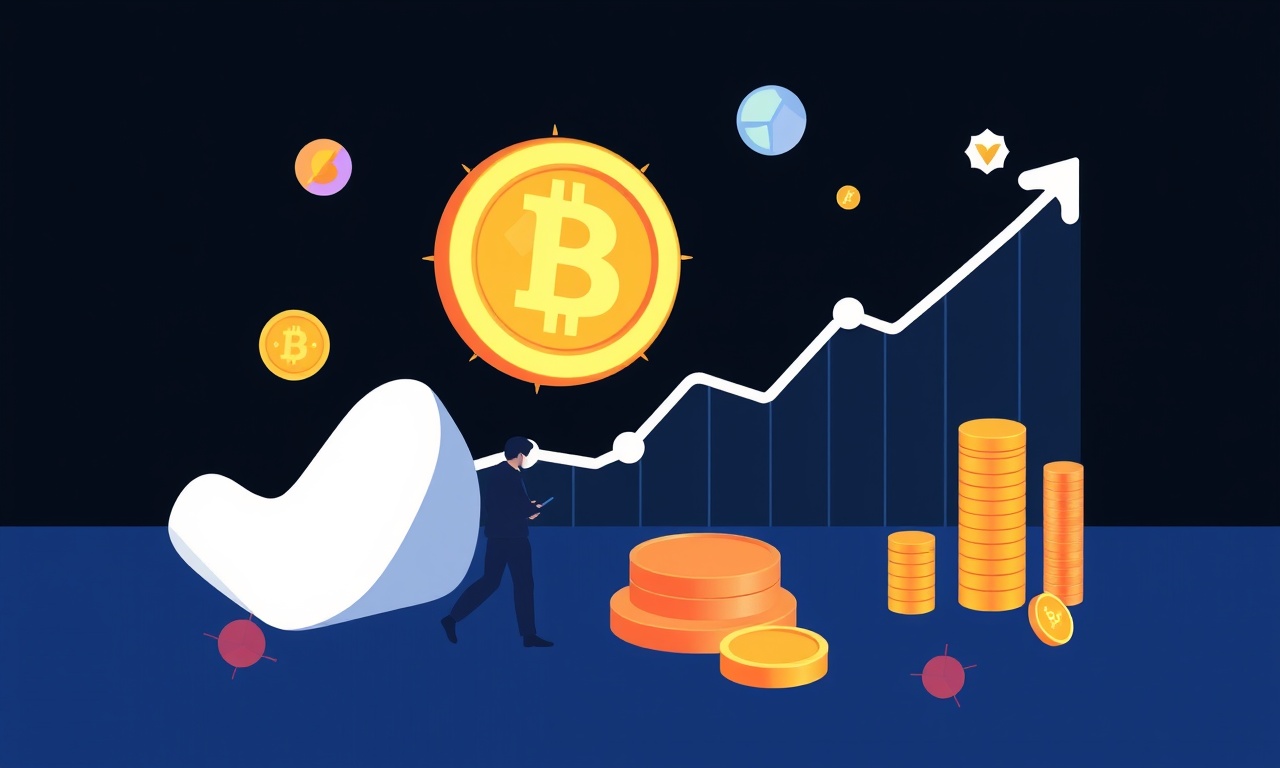
Calculating Risk in Decentralized Finance Through Transaction Metrics

It’s late on a rainy Lisbon evening and I’m staring at a dashboard that flickers with green numbers. A new yield farm has just been launched on the Polygon network, offering 12 % APY. The marketing copy promises “instant liquidity” and “no risk of impermanent loss.” The excitement is palpable. I almost take a screenshot, thinking about how many people will chase that next big yield without ever checking the on‑chain ledger. That’s the moment when fear and hope collide: the fear of losing savings to a smart‑contract flaw and the hope of a quick, safe return.
Let’s zoom out and talk about how to use transaction metrics to ground that hope in reality. I’ve spent years pulling data from corporate books and then from blockchain explorers; the fundamentals are similar, just written in hexadecimal.
Understanding Transaction Flow
Every DeFi protocol is a chain of transactions. When you deposit, you sign a transaction that calls a smart contract. That contract calls another, perhaps a liquidity pool, maybe a lending market. The entire chain is recorded on the blockchain, and every step is visible to anyone who wants to look. Think of it like a garden: each seed (transaction) is a small action, but the ecosystem (protocol) is only as healthy as the root system (underlying contracts) and the soil (network conditions).
Key On‑Chain Metrics to Watch
- Total Transaction Volume – The amount of crypto moving through a protocol over a given period. High volume can signal liquidity and adoption, but it can also expose a protocol to high volatility and congestion. (See how on‑chain volume can be used to quantify market volatility): On Chain Volume.
- Number of Unique Signers – How many distinct addresses are interacting? A concentrated user base may mean higher risk of a coordinated attack or sudden withdrawal. (Explore the link between transaction frequency and yield performance): Transaction Frequency.
- Gas Used Per Transaction – Gas is the unit of computation. The more gas a transaction consumes, the higher the cost for users and the greater the impact on the protocol’s gas fee budget. Predictive models of DeFi fees can help gauge these costs: Gas Cost Forecast.
- Average Gas Price – Measured in gwei, this reflects network congestion. Sudden spikes can inflate costs and reduce returns for yield farmers.
- Contract Call Depth – The number of nested calls a transaction makes. Deeper depth usually means more complex logic and a higher probability of a bug or re‑entrancy issue.
- Historical Failure Rate – The percentage of failed or reverted transactions. A spike in failures can signal an issue with the contract or the underlying liquidity.
- Liquidity Concentration – The proportion of total liquidity held in a single token or pool. Concentration can lead to significant slippage or impermanent loss if one asset drops. Deep dives into on‑chain liquidity metrics reveal these dynamics: Liquidity Insights.
These metrics can be pulled from tools like Etherscan, BscScan, or more sophisticated analytics platforms such as Dune Analytics, Nansen, or The Graph. A quick look at a contract’s “Transactions” tab will show you the raw numbers; for deeper analysis you’ll want to export the data into a spreadsheet or a Jupyter notebook.
Gas Analysis: The Invisible Cost
Gas isn’t just a fee. It is a proxy for complexity and risk. A simple ERC‑20 transfer typically consumes around 21 000 gas. A transaction that swaps tokens via a decentralized exchange might use 70 000–100 000 gas, depending on the number of hops and the complexity of the contract logic. If a protocol’s core function requires 200 000 gas, that’s a lot of computational effort.
Why does that matter for risk?
- Cost to Users – High gas means that the net yield shrinks. A 12 % APY on a 100 MUSD deposit can be eroded if the annualized gas cost reaches 2 %.
- Protocol Sustainability – The protocol itself earns a fraction of the gas fee in the native coin (ETH, BNB). If that fraction is low, the protocol’s incentive to stay online can be weak.
- Attack Surface – Complex contracts provide more vectors for bugs. Each additional gas unit can introduce a new state change or external call that an attacker could exploit.
When looking at gas metrics, it helps to plot a trend line. A sudden uptick could signal a congestion event or the start of a front‑running attack. In the last year, Ethereum’s gas price spiked by more than 300 % during a market rally, wiping out a significant portion of miners’ profits and forcing yield farms to temporarily pause.
Smart‑Contract Risk: The Heart of DeFi
Contract Age and Audit History
A protocol that has been live for only a month and has never been audited is a red flag. Audits are expensive, but they provide a written, third‑party assurance that the code behaves as intended. Look for public audit reports from reputable firms like CertiK, Trail of Bits, or OpenZeppelin. If the audit is old, verify whether a new version of the contract has been released and whether the audit covers it.
Upgrade Mechanisms
Many protocols use proxy patterns to allow upgrades. That is useful for fixing bugs, but it also introduces a governance risk: the upgrade authority could be abused to implement malicious code. Check whether the governance token has a large concentration of holders. A governance token held by a few addresses gives a single actor control over upgrades.
Re‑entrancy and State Management
Re‑entrancy was the hallmark of the DAO hack. Even if a contract is well‑audited, state changes must be carefully ordered: write state, then make external calls. Look for patterns such as transfer() calls after state changes. If you’re comfortable with Solidity, you can run static analysis tools like Slither or MythX to flag potential re‑entrancy issues.
Front‑Running and MEV
Transaction ordering is not random. Miners can reorder transactions to capture arbitrage opportunities. If a DeFi protocol allows large trades that move the market, front‑running can reduce the expected return. Tools like Flashbots provide visibility into MEV (Miner Extractable Value). A protocol that consistently shows high MEV activity may be risky for users who care about fairness.
Liquidity Risk: The Garden’s Roots
Liquidity is the lifeblood of any DeFi protocol. If the pool dries up, withdrawals are delayed, slippage spikes, and impermanent loss rises. Measure liquidity risk by:
- Pool Depth – The total value locked (TVL) divided by the size of the largest single trade that can be executed without causing >1 % slippage.
- Liquidity Concentration – How many tokens are locked? If 90 % of liquidity is in a single asset, a price drop of that asset will severely damage the pool. See how quantitative on‑chain data can uncover liquidity concentration: Liquidity Insights.
- Liquidity Provider Incentives – High reward rates can attract speculative liquidity that is withdrawn quickly, leaving the pool vulnerable to sudden exit.
When you notice that a protocol’s TVL is stable but its liquidity is concentrated in one token, think of a garden where one tree carries all the weight. If that tree falls, the entire structure collapses.
Governance Risk: Who’s Pulling the Strings?
Governance tokens are the DeFi equivalent of a community vote. The distribution of these tokens determines who can change the protocol. If a single entity holds >50 % of the voting power, a governance attack is trivial. Check the token distribution on a snapshot tool or a governance analytics platform. A healthy governance structure typically features:
- A dispersed token supply among many wallets.
- A clear, transparent voting process with a minimum quorum.
- A public proposal system where code changes are reviewed before being executed.
If a protocol has a “super‑user” that can submit proposals unilaterally, you should treat that as a risk.
Systemic Risk: The Market as an Ecosystem
DeFi protocols don’t exist in isolation. They are part of a larger ecosystem that includes:
- Price Oracles – Many protocols rely on external price feeds. Oracle outages or manipulation can freeze the protocol or cause incorrect collateralization ratios. Read about decoding DeFi economics through on‑chain metrics: Decoding DeFi Economics.
- Cross‑Chain Bridges – Moving assets across chains introduces additional trust assumptions.
- Regulatory Shifts – Jurisdictional changes can affect how protocols operate or how users are treated.
When calculating risk, consider how a failure in one component could cascade through the ecosystem. Think of a storm that damages one bridge, leading to traffic jams on adjacent roads. The impact can be amplified.
A Practical Example: Uniswap V3 on Ethereum
Let’s walk through an actual analysis of a popular protocol: Uniswap V3 on Ethereum. I pull the data from Etherscan for the last month.
- Total Transaction Volume: 1.2 billion USD.
- Unique Signers: 500,000.
- Average Gas Used per Swap: 80,000 gas.
- Average Gas Price: 60 gwei.
- Failure Rate: 0.5 %.
- Liquidity Concentration: 70 % of TVL in the USDC/ETH pair.
The gas cost per swap averages around 0.004 ETH. At 4 % APY, the annualized cost is roughly 3 %. Not negligible, but not catastrophic either. However, the concentration in USDC/ETH suggests that any large movement in ETH could create significant slippage, especially for traders with large orders. The failure rate is low, indicating that the contract logic is robust. The audit history is solid, with two independent audits. Governance token distribution is fairly even, but there’s a small cluster of addresses holding >10 % each. That could be a potential risk, but currently the governance proposals show a low voting threshold, meaning any one of these clusters could influence protocol changes.
In short, Uniswap V3 has a high transaction volume, stable failure rate, and strong audit trail, but its liquidity concentration and governance structure present mild risk factors.
Putting It All Together: A Risk Checklist
- Contract Audit – Is there a recent audit? Does it cover the current version?
- Gas Metrics – How much does a typical transaction cost? Is the cost sustainable for users?
- Liquidity Health – What is the depth? Is liquidity diversified?
- Governance Structure – Who can vote? Is the token distributed?
- Historical Performance – Are there spikes in failure or slippage?
- Oracles & Bridges – Are they reliable?
- Regulatory Landscape – Is the protocol compliant in your jurisdiction?
If you can answer “yes” to most of these, you’re in a comfortable position. If not, you may want to allocate a smaller portion of your portfolio to that protocol or seek alternatives.
The Human Side: Why This Matters
We all want a tool that lets us control our financial future, not a black box that runs on cryptic code. When we look at the numbers, we should feel a sense of stewardship rather than anxiety. The next time you hover over a protocol’s dashboard, pause and ask: what does this gas price mean for my next trade? Who is backing the smart contract? How might a governance proposal affect my stake? The answers may not be perfect, but they will give you a clearer picture.
And remember: “Markets test patience before rewarding it.” That holds true in DeFi as well. A protocol that rewards short‑term speculation without strong fundamentals will eventually falter. A protocol that emphasizes transparency, robust audit trails, and diversified liquidity will weather storms.
Actionable Takeaway
Before you commit your capital to any DeFi protocol, run a simple three‑step check:
- Audit Check – Verify the latest audit report.
- Gas Cost Analysis – Calculate the average gas cost per transaction and compare it to the expected return.
- Liquidity Snapshot – Look at the TVL distribution; ensure no single asset dominates more than 30 % of the pool.
If any of these steps raise a red flag, consider either reducing exposure or waiting until the protocol improves its transparency.
That’s it. Keep your curiosity, stay skeptical, and let data guide you—not hype. Good luck, and happy farming, but with your eyes on the metrics that matter.

.png)
Sofia Renz
Sofia is a blockchain strategist and educator passionate about Web3 transparency. She explores risk frameworks, incentive design, and sustainable yield systems within DeFi. Her writing simplifies deep crypto concepts for readers at every level.
Random Posts

Unlocking DeFi Fundamentals Automated Market Makers and Loss Prevention Techniques
Discover how AMMs drive DeFi liquidity and learn smart tactics to guard against losses.
8 months ago

From Primitives to Vaults A Comprehensive Guide to DeFi Tokens
Explore how DeFi tokens transform simple primitives liquidity pools, staking, derivatives into powerful vaults for yield, governance, and collateral. Unpack standards, build complex products from basics.
7 months ago

Mastering Volatility Skew and Smile Dynamics in DeFi Financial Mathematics
Learn how volatility skew and smile shape DeFi options, driving pricing accuracy, risk control, and liquidity incentives. Master these dynamics to optimize trading and protocol design.
7 months ago
Advanced DeFi Lending Modelling Reveals Health Factor Tactics
Explore how advanced DeFi lending models uncover hidden health-factor tactics, showing that keeping collateral healthy is a garden, not a tick-tock, and the key to sustainable borrowing.
4 months ago

Deep Dive into MEV and Protocol Integration in Advanced DeFi Projects
Explore how MEV reshapes DeFi, from arbitrage to liquidation to front running, and why integrating protocols matters to reduce risk and improve efficiency.
8 months ago
Latest Posts

Foundations Of DeFi Core Primitives And Governance Models
Smart contracts are DeFi’s nervous system: deterministic, immutable, transparent. Governance models let protocols evolve autonomously without central authority.
2 days ago

Deep Dive Into L2 Scaling For DeFi And The Cost Of ZK Rollup Proof Generation
Learn how Layer-2, especially ZK rollups, boosts DeFi with faster, cheaper transactions and uncovering the real cost of generating zk proofs.
2 days ago

Modeling Interest Rates in Decentralized Finance
Discover how DeFi protocols set dynamic interest rates using supply-demand curves, optimize yields, and shield against liquidations, essential insights for developers and liquidity providers.
2 days ago